“Word that will inspire” is a talk that I have presented at LondonR on the 25th June 2019 and at EARL 2019 conference in London on the 11th September 2019.
“Words that will Inspire” is an analysis on 2,500+ TED talks using text analytics and machine learning on R to find the factors that make some talks more popular than others. Below you will find readable version of my presentation.
What was the motivation of doing project?
I am part of a meetup group called Data Scientist speakers in London that meet regularly to practice data science talks and receive feedback to improve public speaking.
Every year at the club we have a competition to see who can come with the best data science story. I joined this competition and wanted to make participate with something special: I wanted to combine my data science skills to analyse famous speeches or talks and use these insights to build an entirely new one.

What was the source of inspiration?
I started my analysis with three of my most favourite speeches, they were given by the most remarkable public speakers and their talks have inspired millions of people shaping the world we live today.
Can you recognise these speeches and their speakers from the following snips?

I am are talking about John F. Kennedy, Martin Luther King Jr and Winston Churchill.
The back-of-the-envelope calculation
With these three speeches I analysed the frequency of words that they were using and I came with a big surprise…the most used word on each speech is the same! Can you see it in there just middle of the word clouds?

The most used word by the three speakers is “Will” (Winston Churchill used Shall, proper British style!). They potentially used the word “Will” as a way to inspire people to take action or to indicate that something will change in the future. In addition to this similarity, the three speakers also used something that is called structural repetitions. They repeat the same phrase many times to create impact and remembrance.
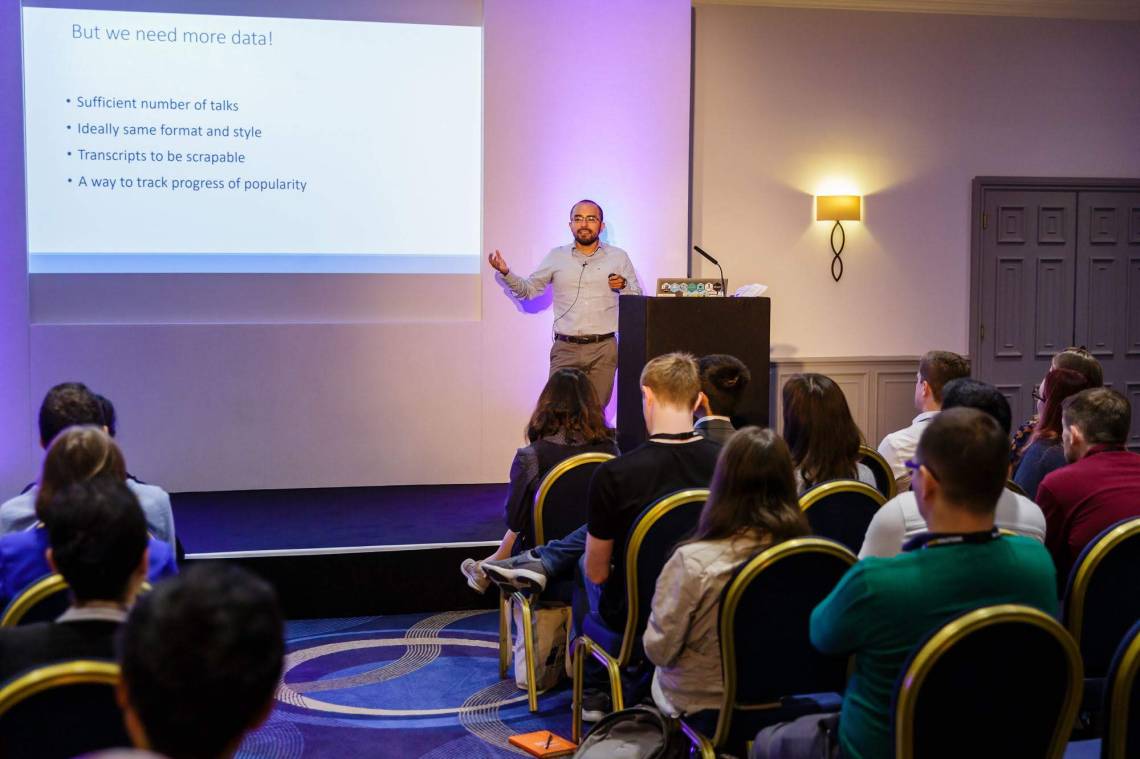
But we need more data!
These coincidences made me think that there could be potentially patterns in the words that can make a speech more inspiring. But definitely three speeches are not enough data to draw conclusions and this put me in the search of finding a suitable group of talks that I can analyse. Ideally to perform a data analysis, the talks should have:
- Sufficient number of talks to analyse
- Ideally the same format and style to avoid any strong bias of having different format of talks
- There should be available transcripts as this will reduce time and effort
- And for the use of machine learning, there should be a way to track progress of popularity to detect more inspiring talks against the less inspiring ones
The Eureka moment
It seems that to find a set of talks with these considerations could be difficult task. However I quickly realised that there were already talks with all these characteristics: Ted Talks!
Ted talks that are on a similar style and they are thousands of them, they keep track of popularity and they have available transcripts and other information such as view counts and comments on their website. To make things easier, the data science competition website Kaggle has already published all these data and made it available to anyone to download them on a suitable format.
The Data Science Approach
With the data now available I was ready to perform my analysis which can be divided in three stages:
I. Data extraction and feature engineering
II. Data Analysis and Model Ensemble
III. Model Insights

I. Data extraction and feature engineering
The dataset provided by Kaggle was quite a lot of data that needed to be transformed first to perform the analysis. I am a regular user of R but was not very familiar with text analytics so basically I followed everything that was on the book “Text mining with R”. This book is definitely The source for text analytics using R.
The dataset contained all TED talks events with all their transcripts and any other data that you can see in their webpage. One really good point is that it also includes the date that the data was extracted, the published date of each TED talk in the website and their filmed date. These characteristics will become important to perform the predictive analysis in the search of patterns by using the machine learning algorithms
I built more than 50 features as potential factors to test why some talks were more popular than others. Mostly of these original set of factors were related to frequency analysis on word counts such as:
- How fast the speakers talk by using the words per minute, the number of sentences they said and the number per words per sentence
- The audience reaction by using one interesting feature found in the transcripts include of the specific occasions that the audience laughed, applause, the number of questions
- And I included many counts of the most frequent n-grams to see if there were specific words that they tend to repeat
With these factors my aim was a classification problem to predict if a ted talk will become popular or not

II. Data Analysis and Model Ensemble
This stage can be summarised in the following steps
1. Descriptive Analysis: One of the key features on the analysis was to standardise in some way the amount of time that the Ted Talk has been available online. The more time a TED talk have been available on the website the more chances there are for more views. Therefore I standarised the averaging the metrics per month rather than using totals.
2. Correlation analysis: Many of the variables will tend to be correlated with others. Therefore one technique that I use is to only use the most predictive variable (on an univariate level) and discard the less predictive one that was correlated with.
3. Additional Feature Engineering: Some n-grams were correlated between them as their were using the same word so I combine those useful n-grams that were similar into just one variable.
4. Model Assessment: I started analysing the data at univariate level using logistic regressions to find the most most relevant variables and discard variables that were non predictive at all. Using the top 20 most relevant individual variables I started to develop manually several type of models including logistic regressions, random forest and XGBoost by adjusting the hyper parameters, variables bins and different variable selection methodologies.

In addition to the models developed manually, I used the AutoML feature of H2O that develops automatically several types of models like Stacked Models, Deep Learning and other Gradient Boosting Methodologies. This automatic modelling techniques will help me to get a reference of how other type of models will perform against the ones that I developed manually.

III. The Model Insights
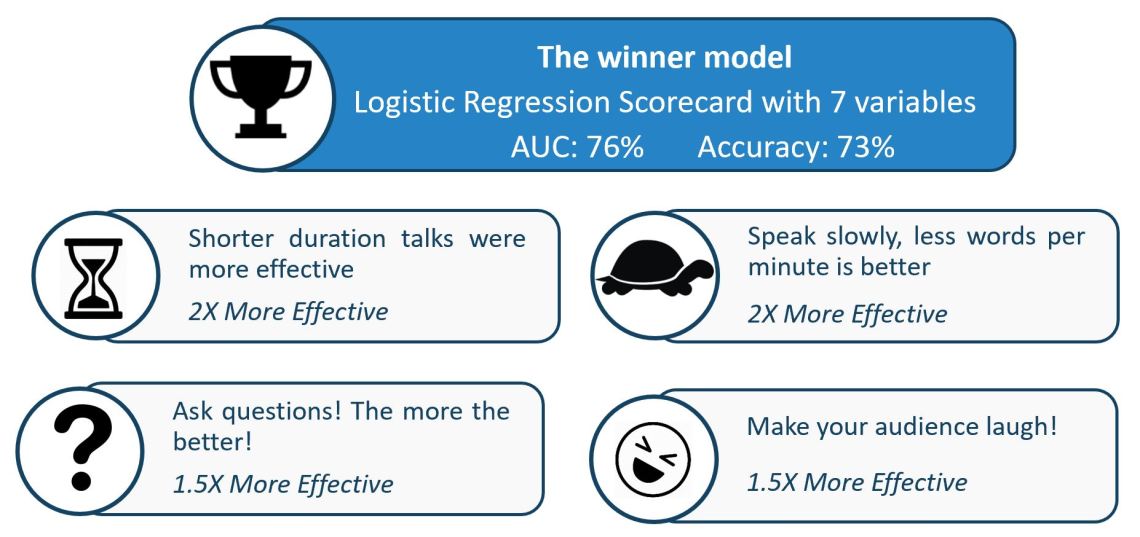
Surprisingly the different types of models that the H20 developed were not far away in terms of performance than the Manual Logistic Regression model developed. Therefore I decided to use the logistic regression to make it easier to explain how the predictions were built. In order to make the models even easier to understand and avoid any issues with outliers I binned the independent variables in quartiles in the final modelling stage. The final model had seven variables, an AUC of 76% and an Accuracy of 73% of predicting correctly a popular talk.
The winner model had insights showed me that:
- Shorter duration talks were more effective than longer ones
- Speaking slowly was more effective, this was measured by calculating the words per minute by using the total words in talk and its duration
- Asking questions during the talk was more effective. This was measured by identifying the questions marks in the transcript
- Making the audience laugh was more effective. This was measured by identifying the appearances of the Laugh captions in the transcript
With this final model I also checked the highest and lowest predicted scores and review how the models were ranked. in here from left to right we got from the bad performing talks to the better ones (without trying to underestimate the lowest scored of course!).
- On the lowest ranked models I found the talk of Ethan Zukkerman with “Listening to global voices” was performing poorly. This one had the lowest scores in every single variable (long duration, fast speaking, hardly any questions of laughs)
- The Google guys Sergey Brin and Larry Page came also quite on the lower scores
- Jeff Bezos with the talk on “The electricity metaphor for the web’s future” was also in the lower scores
- On the highest scored talks by the model was Stephen Hawking with the talk “Questioning the universe”. This talk scored quite high in the variables of the model with the help that the talk was about asking a lot of questions and also with speaking slowly (as the assistive voice is quite slow!)
- One of the flagships of good talks was from Alan Smith with the talk “Why you should love statistics”. It gives me hope that a statistician can be a really good speaker!

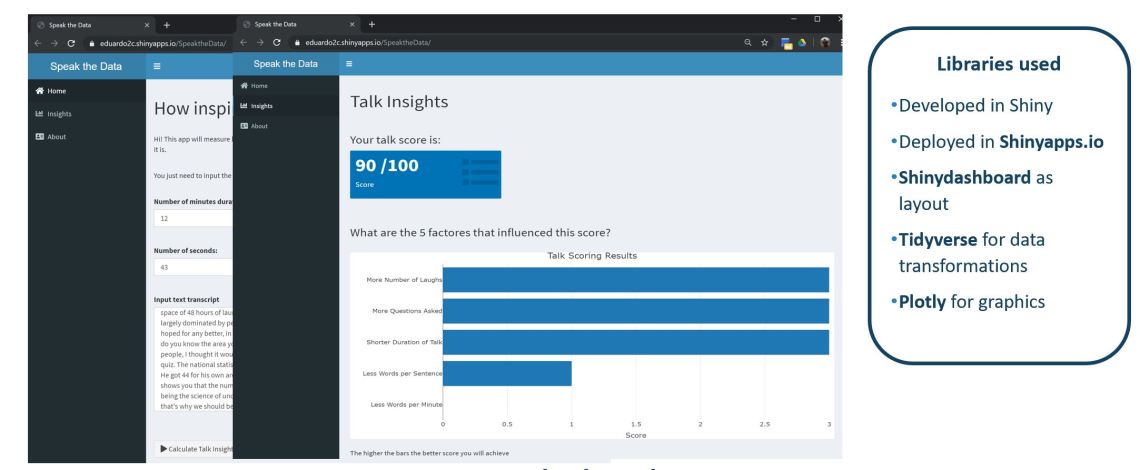
Now with a developed model, why not to make it usable for everyone! I used Shiny and ShinyApps to deploy an online tool that you use in the section Analyse Your Talk of this website. Please follow the instructions of what you need to do is just to put a speech and will rank how good it will perform and what you can do to improve it!
What did I learn from this project?
I found that there are factors that can help to predict if a talk will become popular and they based on the use of words like asking questions, speak slowly, use humour and be concise.
This project continues as I would like to introduce sentiment analysis and develop a live recommendation system to rank how any talk will perform and indicate where you should focus to improve it
Finally, I learned that using a side project from work can be also be really fun and to experiment and learn new data science topics and how to make better talks!
Below you will find the presentation that I used at the event
And some photos of the events

Here are some useful links from this talk
- LondonR events: https://www.londonr.org/
- Data Science Speakers club: https://www.meetup.com/datasciencespeakers/
- Text Mining with R book: https://www.tidytextmining.com/
- Kaggle TED Talks dataset: https://www.kaggle.com/rounakbanik/ted-talks
Cheers,
Eduardo
