Who would like to have the sexiest job of the century?
Probably you may come across some years ago the following article from the Harvard Business Review.
Before that time, when someone was asking my profession I was saying really proud that I was a statistician and an actuary. Short after this article, I definitely rebranded myself also as a data scientist, because who wouldn’t want to have the sexiest job of the century!
I think also that this article made many people that were not in the analytics industry to become more interested in the profession and potentially to be one of them.
Is it really the sexiest job of the 21st Century?
I definitely agree that Data science is a very interesting profession. It comes at a time that three main things have happened:
- Computers are really fast and everyone can have access to low cost but high spec machines (like those Virtual Machines with GPUs included)
- Storage for large volumes of data is really cheap
- Open source software and free online courses make accessible to learn the basics of programming and data science techniques
With these low access barriers to the industry it is quite attractive to become a data scientist and have the sexiest job of the century. However, I think that getting to know to use these three components do not cover entirely what a data scientist really does. The aim of this article is to try to answer two questions:
- What is the essence of a data scientist?
- How to become a better data scientist?
What is a data scientist?
Two dictionary definitions highlight the following

Both definitions highlight the use of computers and the usage of different disciplines that combines scientific methods, processes and algorithms. I agree that these definitions are part of what a data scientist does in a daily basis but I feel that they do not capture the essence and the passion that I feel about be a data scientist.
Stepping away from these dictionary definitions, one common understanding in the industry of a data scientist is the following Venn diagram that I have seen in many different occasions.

Similar to the dictionary definitions, a data scientist appears to be someone that effectively can combine IT skills, Maths/Statistics and Business Knowledge. However, I think that this combination of skills also fails to capture what I do every day as a data scientist. It is like saying that combining someone that knows about Pots & Pan , Agriculture, Livestock and Ovens it is what really makes a Chef!
What is the truly essence of Data Science?
During this pandemic I found a book that immediately hooked me with from the start: The Art of Statistics from David Spiegelhalter.

This book is aimed for everyone regardless of industry, age or educational background and covers the importance of being data literate and how to acquire such skills. Data literacy means to have the necessary skills to be able to understand and challenge information that appears on news or media that were based on data analysis. The perfect example is how to understand the now popular logarithmic graphs of deaths from Covid-19 around the world.
Just immediately on the first chapter of this book I found what it was missing from the previous data scientist definitions and is capture in one definition:
Data Science is an investigative process of problem-solving techniques using data for decision-making outcomes
Moreover, the author highlights that the application of Statistics, Machine Learning or AI should be just one component of the cycle of investigation. In addition of this definition, I would also add to the author’s point that any data science software or programming language should be just seen as merely a tool to help this investigation process.
From these concepts, I consider that the essence of a data scientist is to be a Sherlock Holmes of data rather than a multi-tool swiss army knife of data tools.
How to become a better data scientist?
To become a better data scientist in my opining is to become better in this investigative process. The author covers the PPDAC cycle developed by R. J. MacKay and R. W. Oldford that was initially aimed to teach statistics. This cycle is represented in the diagram below:
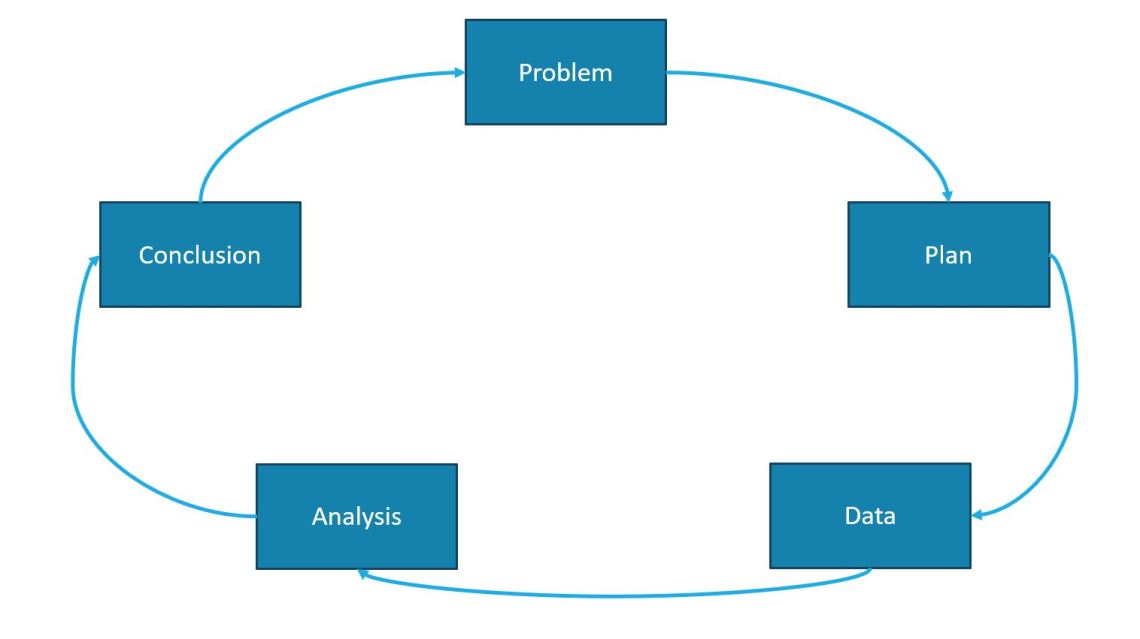
I summarise below each stage of this cycle providing an example based on data problems
a) Problem Stage
Key questions to answers on this stage:
- What is the definition of the problem to solve?
- How do we go about answering this question?
- Can data solve this question?
Example: Lets imagine that we have all the historical data of earthquakes around the world. This could include information the date of occurrence, the place, the intensity, the duration. Can we build a model that will forecast with a good accuracy the next earthquake? It certainly feels that we know what the problem is but it seems that data by itself could be limited to provide a good forecast of the when and where of the next earthquake.
b) Plan Stage:
Key questions to answers on this stage:
- What are the tasks and analysis to perform? (Plan ahead, really ahead!)
- What to measure and how?
- Study design? Recording? Collecting?
Example: The analysis of data it should not be only focused on data that is already observed but on the entirely process from obtaining that data, analysing it and the applying those insights. A famous example is the case of the one million dollar Netflix challenge to develop and algorithm to improve its movie recommendation engine. Ultimately the implementation of the new algorithm was not used largely due to its complexity and change in business priorities.
c) Data Stage
Key questions to answers on this stage?
- How good is the data quality?
- How has the data been managed and will be managed?
- How much data cleaning is necessary to do?
Example: This is maybe one of the most critical parts of the data cycle and where normally most of the times is spent because data is never perfect. Knowing the data quality will ultimately impact the quality of the insights. In addition data is constantly changing and updating so it is also important to acknowledge the impact of new observed data and the way to include them in new insights.
d) Analysis Stage
Key questions to answer on this stage:
- How to visualise the data? What kind of tables and graphs to build to understand it?
- What patterns are visible and identifiable? What kind of methods and complexity is required to use to identify the patterns?
- What kind of hypothesis are necessary to formulate?
Example: Before starting to perform any statistical methods, Machine Learning or AI technique the first step should be to carry a descriptive and visual analysis of the data. Tables and data visualisations are ideal to start identifying patterns and start generating hypothesis. Only after this point it comes the more complex methods to further analyse the data and validate insights.
d) Conclusion Stage
Key questions to answer on this stage:
- How to interpret the results of insights?
- What to conclude from the results and what are its limitations?
- How to communicate the results and generate new ideas?
Example: The last step of the process is crucial to be able to explain as simple as possible the insights found from the data analysis regardless the complexity of the analysis. Moreover this interpretation should also be tailored for the communication to any potential audience and avoid any confusion of what these results means.
Final remarks
Data Science is not just about using specific software to apply statistical or ML techniques and find patterns. Data science is more a continuous investigation problem that will help us finding knowledge using data. The better we become formulating a process of how to question data, the better data scientist we become.
The above material was originally presented at Toastmasters Data Science Speakers club via Zoom on the 29th June 2020. For more details to join our next meeting follow https://www.meetup.com/datasciencespeakers/
Sources
- Article “Data Scientist: The Sexiest Job of the 21st Century”
https://hbr.org/2012/10/data-scientist-the-sexiest-job-of-the-21st-century - Scientific Method, Statistical Method and the Speed of Light
R. J. MacKay and R. W. Oldford
https://projecteuclid.org/euclid.ss/1009212817 - The Art of Statistics: Learning from Data by David Spiegelhalter
https://www.penguin.co.uk/books/294/294857/learning-from-data/9780241258767.html
